PV Tech has launched a new monthly newsletter which will focus on the data behind the solar PV industry. Each month, the newsletter will include an exclusive, never-before-seen chart focused on one particular topic. These interactive charts will allow you to access more information directly from the email client by simply hovering over the data.
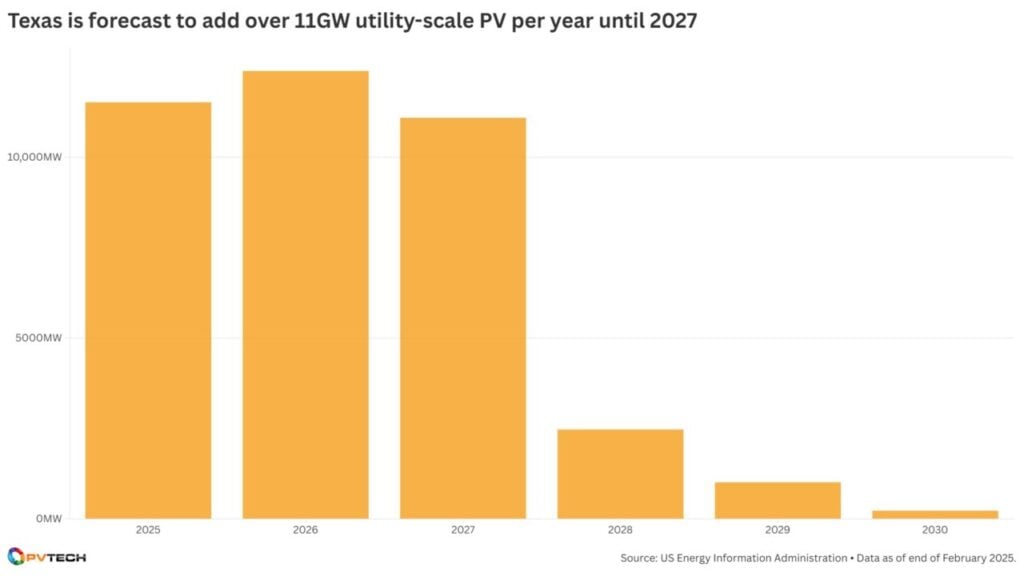
For the inaugural newsletter and to coincide with the upcoming Large Scale Solar Summit USA (29-30 April) event in Dallas, Texas, this month’s exclusive chart looks at one of the leading US states in solar PV: Texas.
Unlock unlimited access for 12 whole months of distinctive global analysis
Photovoltaics International is now included.
- Regular insight and analysis of the industry’s biggest developments
- In-depth interviews with the industry’s leading figures
- Unlimited digital access to the PV Tech Power journal catalogue
- Unlimited digital access to the Photovoltaics International journal catalogue
- Access to more than 1,000 technical papers
- Discounts on Solar Media’s portfolio of events, in-person and virtual
Or continue reading this article for free
The chart examines how the state’s upcoming utility-scale solar pipeline fares with other states, when and how much capacity will be added in the coming years, and which regions will add the most capacity.
In addition to the exclusive chart of the month, the newsletter also showcases charts from some of our recent articles, covering financial results, capacity additions, auctions and tenders and a variety of other topics that vary from month to month.
The inaugural edition covered capacity additions in the US—which added 50GW of PV capacity in 2024— and worldwide. In addition, we look at the financial results of solar manufacturers Canadian Solar, JinkoSolar—with charts showcasing the companies module shipments on a quarterly basis—and US residential installer Sunnova, how the origin of solar cells has impacted the price of modules in the US (Premium access), France’s latest rooftop solar results, and finally, US president Donald Trump’s rapidly-paused tariffs get a chart showing how some countries with a solar manufacturing footprint have been impacted.
Subscribe to ‘The PV Data Dispatch’ today.


