The uncertainty in energy yield forecasts is frequently underestimated. Keith McIntosh of PV Lighthouse describes the reasons why, the ramifications, and the steps that the PV industry is taking to improve forecasts.
Yield forecasts are an integral part of the PV industry. They inform decision makers at many stages of a solar project, from prospecting to design, financing, commissioning and operations.
Unlock unlimited access for 12 whole months of distinctive global analysis
Photovoltaics International is now included.
- Regular insight and analysis of the industry’s biggest developments
- In-depth interviews with the industry’s leading figures
- Unlimited digital access to the PV Tech Power journal catalogue
- Unlimited digital access to the Photovoltaics International journal catalogue
- Access to more than 1,000 technical papers
- Discounts on Solar Media’s portfolio of events, in-person and virtual
Or continue reading this article for free
Trustworthy forecasts convey many advantages. They allow a developer to better optimise the design of their plant, like sizing the inverters or deciding what land to grade. They give lenders and investors more confidence in future revenues, leading to better financial terms like a lower interest rate or a larger loan. They reassure project builders (EPCs) that a well-constructed plant will pass its commissioning tests. And they help operators assess whether a plant is behaving to expectation and how maintenance schedules might be optimised. Thus, small improvements to yield forecasting have significant financial benefits, particularly in relation to the enormous solar projects of the modern day.
The importance of yield forecasts is evident in the scale of the forecasting industry. There are scores of engineering firms with forecasting specialists, there are about ten software providers that make ever-more sophisticated programs to predict yield, there are a half-dozen companies predicting the weather for solar applications, and there are many meteorology companies making instruments to monitor weather and PV modules. Moreover, most solar conferences now contain sessions solely focused on yield forecasting; in fact, an annual workshop, the PVPMC, is devoted entirely to this field of research.
And yet, despite their importance, and despite the huge resources dedicated to them, yield forecasts are widely considered to be inaccurate.
Forecast uncertainty
A yield forecast constitutes a prediction of the sunlight that will fall upon a solar power plant (the input energy) and a prediction of how much of that sunlight will be converted into electricity (the plant efficiency). Combined, these predictions provide a forecast of the electricity sold to the grid (the energy yield).
This is not an easy task. Consider the solar irradiance: an exact energy forecast for a solar plant requires a perfect prediction of the future sunlight at any point in time for, say, 30 years of operation. That’s clearly impossible. By itself, the year-to-year variability in annual irradiance lies between about ±4% and ±8% at most sites (±two sigma); then there is the day-to-day variability, where the irradiance during one overcast day might be 80% less than during the previous sunny day; and there is the minute-to-minute variability, where the solar irradiance might suddenly halve when the sun ducks behind a cloud.
This high variability poses several complications for forecasters, such as how many years of historical data are required to estimate the future. And how will climate change affect irradiance? And, relevant to this article, how should the uncertainty in the solar irradiance be incorporated into a yield forecast?
Predicting irradiance is hard enough, but that is just one of a plethora of uncertainties. Other major sources include module degradation, shading, the amount of dirt falling on the modules (soiling), the energy that cannot be sold when a plant is disconnected from the grid (curtailment) and the fraction of power lost due to malfunctioning inverters and other components (availability). Moreover, the equations inherent to forecasters’ models are approximations of the real world that introduce yet more uncertainties (model error).
Thus, a yield forecast is not credible without a rigorous analysis of its uncertainty.
Probability distributions
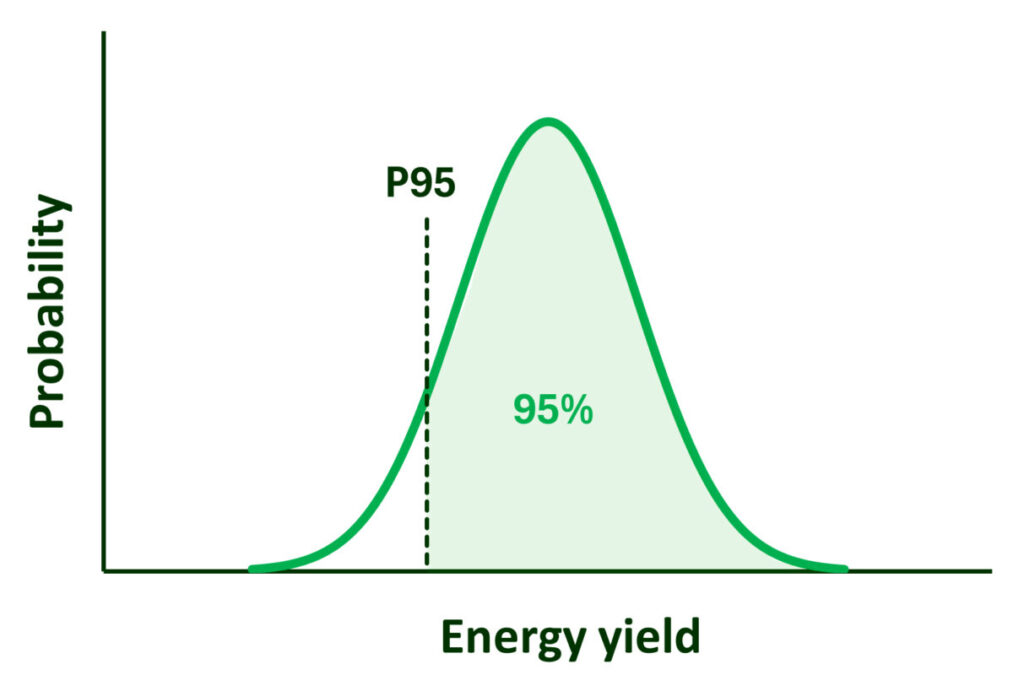
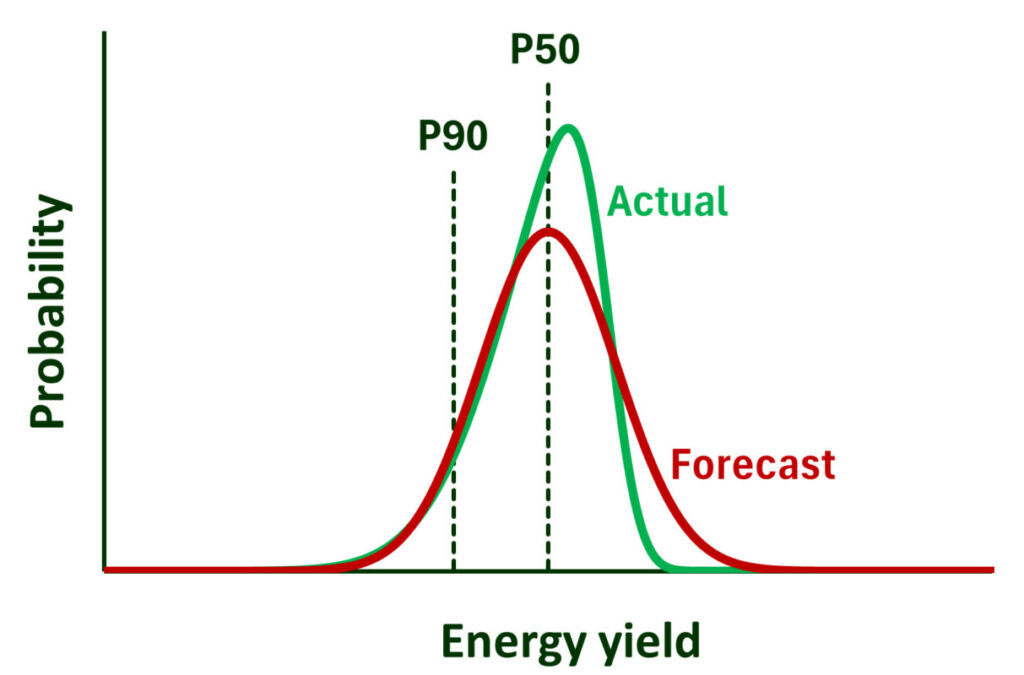
Since forecasters cannot predict yield exactly, they instead provide yield probabilities, where the forecast is almost always represented as a Gaussian distribution—also called a normal distribution—as illustrated in Figure 1.
These probability distributions are often distilled in terms of P-values, which quantify the likelihood that a certain yield will be exceeded. For example, if a forecaster assigns a P95 of 200MWh, the forecaster is saying that they are 95% confident that the plant will produce at least 200MWh. (Mathematically speaking—and as illustrated by Figure 1—the integral of the curve above P95 equals 95% of the curve’s total integral.)
Thus, a P50 represents a forecaster’s best estimate of a plant’s yield. But other P-values are used to decide the financing terms of solar projects, like P90, P95 and P99. These are considered the ‘downside’ forecasts or ‘stress cases’. Lenders are interested in the downside because they need to ensure that a project remains financially afloat, even when it encounters a bad year, or even if its forecast models are overly optimistic.
Owners and operators of PV plants, however, have an interest in the upside as well as the downside. That is, they are interested in the good and the bad years, in the well-performing and the poor-performing plants, in the optimistic and the pessimistic models.
But whether a forecast is received by a lender, an investor, an EPC, an owner, or any other stakeholder, the current perception is that the forecast is not particularly accurate. And they have good reason. Forecasted probability distributions, which from here on we’ll refer to as PXX curves, tend to be both biased and too narrow.
PXX bias
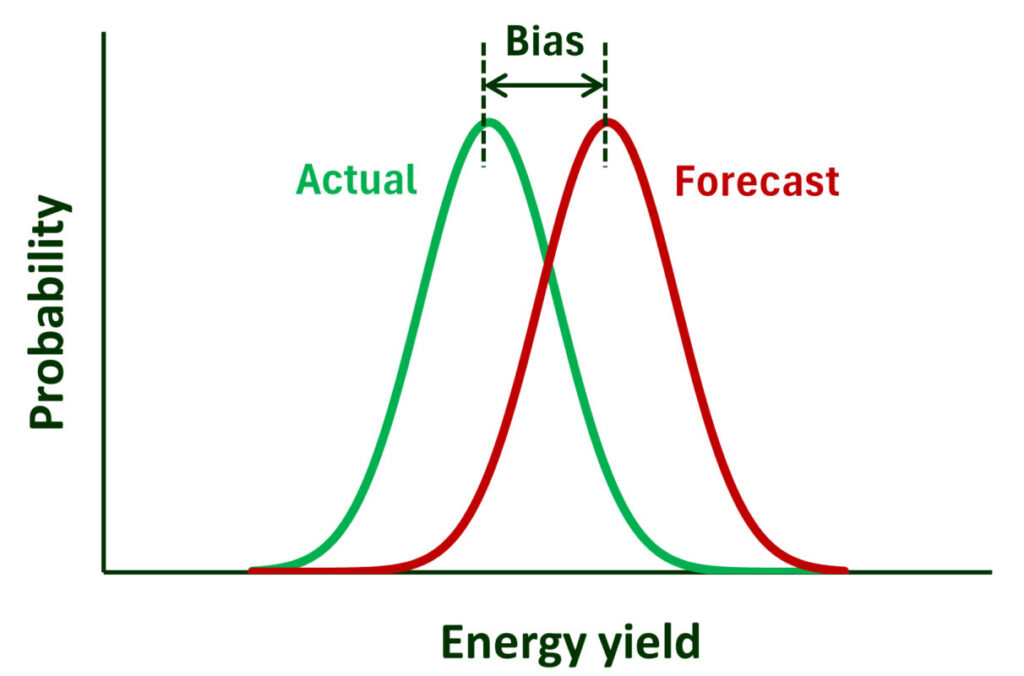
In recent years, many studies have found that forecasts contain a significant bias, whereby, on average, the operational yield is lower than the predicted yield. As illustrated by Figure 2a, a bias represents a systematic shift in the energy distribution curve. Here are four studies that demonstrate how frequently forecasters have overestimated a plant’s energy production.
In 2022, kWh Analytics evaluated over 500 US projects, finding that between 2016 and 2021 the average performance bias in the first year of operation was between -7 and -13% in the first year of operation [1, 2].
The Australian Renewable Agency (ARENA) examined 20 years of operational data from ten projects in 2019 and 2020 and found a median bias of –13%, despite the annual irradiance in both years being higher than expected at practically every site [3]. Much of the overestimate was attributed to curtailment that had been neglected from the forecasts.
In a 2024 study, Wells Fargo examined 32 projects and found that, after correcting for curtailment, the average bias was –6.5%, and after correcting for availability, it was –3.6% [4].
And in a 2023 study, Luminate examined 29 projects that had been in operation for between three and nine years [5]. After correcting for curtailment, availability and irradiance, they found a median bias of about –2%.
Studies such as these have encouraged the solar industry to devote much research to solving the sources of bias. While it is indeed a problem that requires correction, and some recent forecasts appear to have quantified the major sources of bias (e.g., [6,7]), there is another forecasting problem that gains less attention: the error in uncertainty.
PXX width and symmetry
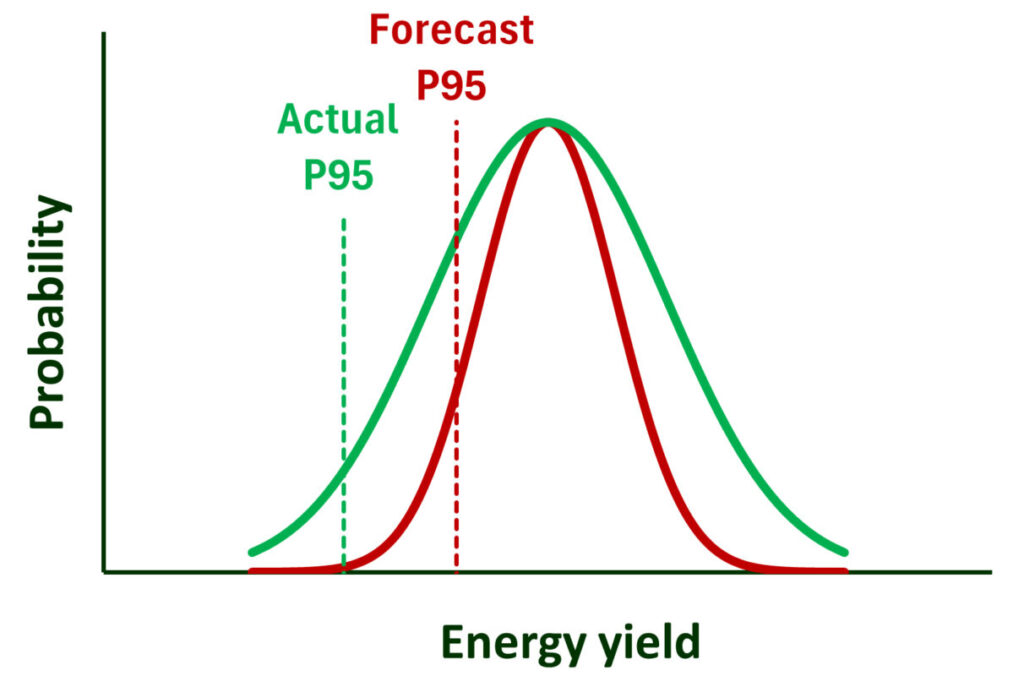
Most forecasted PXX curves are narrower than they should be, which means that they underestimate uncertainty. Moreover, practically all forecasts are symmetrical, whereas operational distributions tend to have longer downside tails than upside tails. Figures 2b and 2c illustrate these two differences between typical and actual distributions.
The four studies described above demonstrate these problems.
In the kWh Analytics study, the availability and curtailment losses were found to have a median of ~98% (i.e. P50), but their long downside tail meant that their averages were closer to 97% and 96% [2]. In fact, the availability and curtailment loss of several projects was less than 90%. In short, the uncertainty in these projects was strongly asymmetric.
In the ARENA study, after accounting for the median bias, the distribution of the 20 sites was much wider than the forecasted distribution for many projects [3]. The P90 was 11.3% lower than the P50, whereas in half the projects, it was forecasted to be no more than 6% lower. This suggests a gross underestimate of the uncertainty in many projects.
In the Wells Fargo study, 10 of the 32 projects, which were all corrected for curtailment and availability, operated at roughly P90 levels, whereas statistically, we would expect only three projects to operate at P90 or worse [4]. Once again, this suggests that the forecasters predicted narrower distributions than they should.
And in the Luminate study, which corrected for curtailment, availability and irradiance, they found a large asymmetry, where 7 projects operated at 3% below the median but only 1 project operated at 3% above the median [5]. Thus, the downside tail was much longer than the upside tail— an asymmetry that is rarely forecasted.
Who cares?
Before we delve into how to improve the forecast uncertainty, we should answer a commonly posed question on this subject: who cares?
One retort can be considered the ‘cynical argument’. It goes something like this: Calculations of PXX are pointless because the financial uncertainty of a project is swamped by a host of unknowns, such as possible changes to government policy, freak weather, unforeseen developments in competing technologies and all the unknown unknowns that might spring forth. Proponents of this argument would say, just build the darn thing and see what happens! To them, a quick and dirty analysis of PXX is sufficient to provide a façade to satisfy the curious.
Well, yes, it’s a lazy argument—any uncertainty analysis can be expanded to include more uncertainties, whether they be based on physics, economics or sociology—but the argument shouldn’t be entirely dismissed. Solar projects have been financed for decades using relatively simple and inaccurate uncertainty analyses.
Even so, while it may be a reasonable response from some stakeholders, particularly those who are isolated from the financial risks and benefits of a project, it doesn’t appeal to lenders, governments, insurers or large owner/developers who balance portfolios of projects in an increasingly competitive industry—and who insist on receiving P-values to assess project funding.
Furthermore, and as mentioned earlier, a trustworthy uncertainty analysis informs decisions at many stages during a project pipeline. For example, what modules or tracker should one select? How much redundancy should be built in to meet energy commitments? How much power needs to be produced to pass commissioning? And many more questions that warrant predictions when designing, building and operating a plant.
Thus, many stakeholders want and deserve a trustworthy PXX. What happens when they don’t get one?
Why uncertainty matters
When a stakeholder distrusts a PXX forecast, whether it’s because they know uncertainties have been omitted, or because they’ve seen operational data that doesn’t agree with forecasts, or because they’ve read articles such as this, the stakeholder adds their own uncertainty to the forecast.
This additional uncertainty might manifest as ‘discounting’ the yield (e.g., reducing the P50 by 2% and the P90 by 4%), or to the addition of extra redundancy in a project (e.g., installing extra modules), or to wide tolerances negotiated into performance testing, or to any number of ways that effectively increase project costs.
Thus, although sources of uncertainty might be neglected, they still seep their way into the project and make it more expensive.
Another reason that it’s important to understand and trust PXX forecasts relates to decision making. If a stakeholder perceives everything to be highly uncertain, that no one can predict a yield to better than ±10% anyway, they can doubt the relevance of the many small decisions in a solar project. Is it worth paying more for a module that produces 0.5% more power? Or is it worth making ground measurements to reduce the uncertainty in the irradiance from ±5% to ±3% or is that advantage swamped by other sources of uncertainty? Should one monitor soiling, albedo, diffuse light, rear irradiance? Is it worth using ray tracing to determine bifacial gains? The answers to such questions are not obvious without a good understanding of the procedure for determining accurate PXX.
The rudimentary status quo
If we conclude that some stakeholders do and should care about PXX, that accurate forecasts are financially beneficial, and that the forecasting industry is large and sophisticated, then why is the forecasted uncertainty so often wrong?
To answer this question, we must first describe the current approach to determining uncertainty.
A forecaster begins by calculating a project’s P50—their best estimate of the energy yield. That estimate takes a concerted effort. It can involve analyses of a site’s weather, of long-term onsite monitoring, of shading, of soiling from dust and pollen. It also contains models to account for the optical, thermal and electrical behaviour of the plant—usually embedded within software programs like PVSyst—and those models contain many inputs that must be justified. Moreover, when adopting the most sophisticated approaches, such as with our own program, SunSolve, forecasting P50 can include ray tracing, large electrical models, spectral evaluation, and solving electrical mismatch.
Then, after expending great pains to produce a P50, many forecasters make a couple of major simplifications and smash out the rest of the PXX curve in no time flat.
We’ll now describe each of these simplifications.
Problem 1 – omitting sources of uncertainty
The first major simplification in PXX calculations is to neglect those sources of uncertainty that are difficult to determine. The specific sources that are neglected vary from forecaster to forecaster, but they often include degradation, curtailment and sometimes availability. (In fact, we’ve seen some forecasts that neglect all sources of uncertainty except irradiance!) Further, various sources within the PVSyst models are usually dumped into a single bucket called ‘model error’.
Now, there can be good reason to neglect some sources of uncertainty. For example, one might neglect availability and curtailment when forecasting plant behaviour during the commissioning period. And, for example, some sources of uncertainty are negligible. But whether sources of uncertainty are omitted wisely or not, there is a large amount of variability in the industry. This makes forecasts difficult to compare, increasing distrust.
Problem 2 – combining uncertainties
The second major simplification pertains to how sources of uncertainty are combined.
Yield forecasters almost always assume that their sources of uncertainty are Gaussian and independent. When justified, these assumptions mean that the final yield distribution will also be Gaussian and easily calculated by the ‘sum-of-squares’ method.
This sum-of-squares method can be explained via a quick example: consider the case where the uncertainty in the irradiance and availability are ±8% and ±6%. If those uncertainties are Gaussian and independent, then the sum-of-squares method tells us that the combined uncertainty from these two sources would be ±10%, since 8² + 6² = 10², á la Pythagoras of Samos.
Enough maths. The point is that when the sources of uncertainty are Gaussian and independent, the probability distribution is easily calculated. But is that simplification justified?
No, not really.
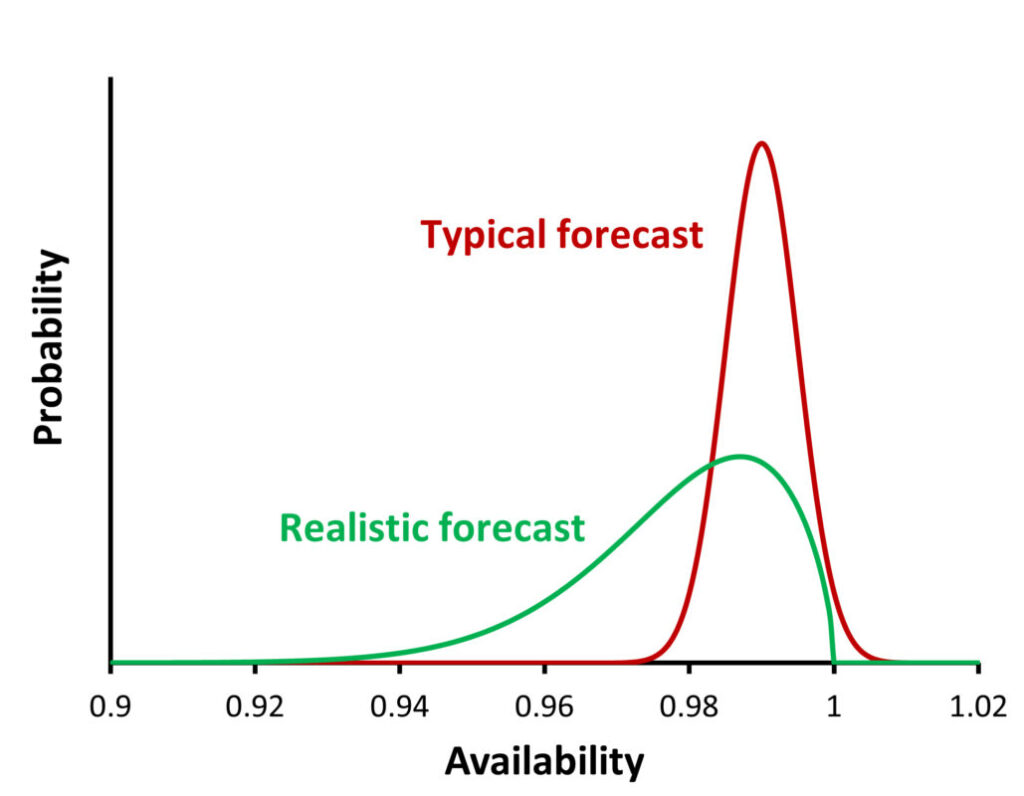
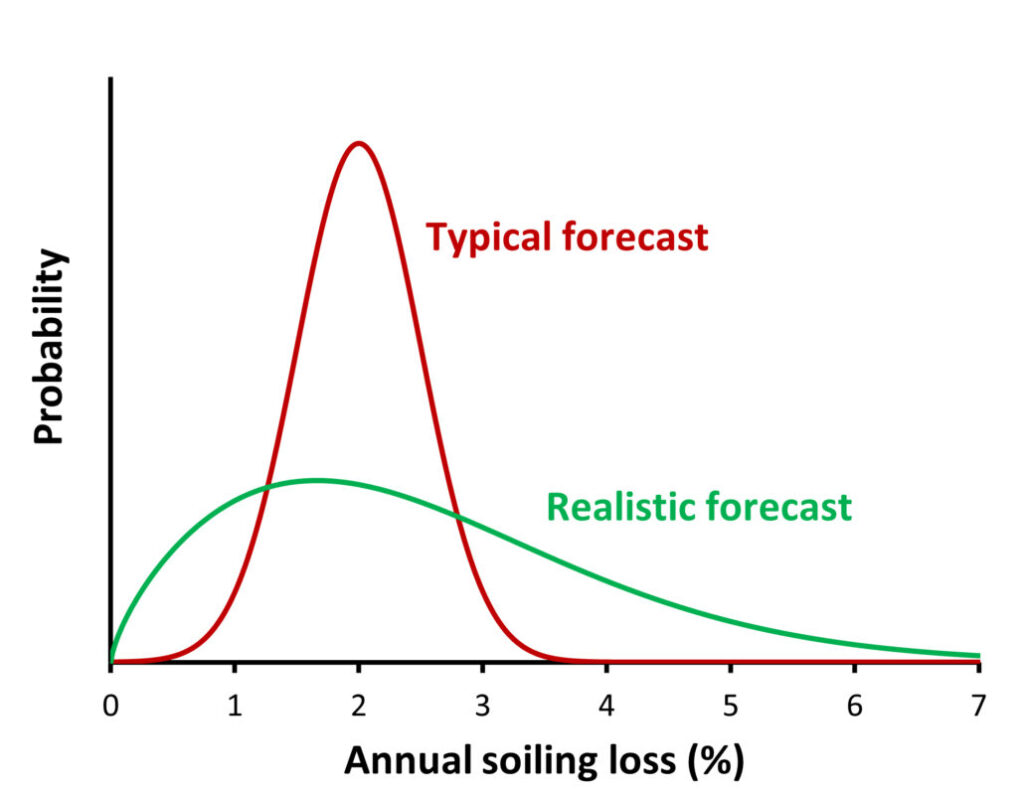
Firstly, and as described earlier, analyses of operational data from multiple plants have demonstrated asymmetric distributions. That would not be possible if the sources of uncertainty were actually Gaussian. In fact, we find that many sources of uncertainty are far from Gaussian. Take, for example, the green curves in Figure 3, which show fits to data of (a) plant availability and (b) annual soiling at a dusty site. Neither of those curves is Gaussian because neither is symmetric. The same is true for the uncertainty in curtailment, in temperature coefficients, in the fraction of sunlight that is diffuse—and for many other sources of uncertainty.
Moreover, not all sources of uncertainty are independent. For example, if the solar irradiance is higher than average it is probable that there is less rain than average and, hence, that there is more soiling than average because there is less rain to clean the modules. And if the irradiance is higher than average, then module temperature and clipping loss and degradation rates are also higher than average. Thus, the uncertainty in soiling, module temperature, clipping and degradation must all correlate to the uncertainty in irradiance.
Solutions and current trends
The good news is that the forecasting industry is now improving its procedures. Here is its three-pronged approach.
The first prong is the quantification of sources of uncertainty. That is, the effort to measure variability in solar projects (not just the average behaviour) has increased in recent years. In 2024, Natural Power published an evaluation of plant availability in 68 projects using 1,800 months of operational data [8]. Their fit to the data is the green curve in Figure 3a, which differs substantially from the default availability of 99% with no uncertainty, or sometimes 99 ± 1% (red curve), that the industry had regularly assumed. Also in 2024, PVRadar described a study into forecasting the soiling uncertainty at any site worldwide [9]. Figure 3b plots our fit to their soiling data of a dusty site, which contains a large asymmetric uncertainty that is quite different to what is often assumed for soiling 2 ± 1% (red curve). Other studies into variability abound, such as those into degradation [10, 11], spectral effects [12, 13] and many more.
The second prong is an increasing interest in explaining and standardising the methodology to determine PXX. A standard simplifies negotiations between project stakeholders because it defines what constitutes a satisfactory uncertainty analysis. For example, Wells Fargo, a major financer of solar projects in the USA, released a technical memorandum in 2020 that described its expectation of what should be contained in any yield forecast [14]. NREL and Sandia completed a project in 2023 into evaluating and improving industry practices, where they report on the current lack of consistency and understanding, and where they explain terminology, procedures, major sources of uncertainty, and best practices [15]. And our own discussions with industry, including an industry survey at the ACP Resource & Tech [16], indicate that there is a wide interest in standardising the uncertainty methodology.
The third prong is the introduction of more sophisticated software to combine uncertainties. We believe that the best method to circumvent the sum-of-squares approximation is to employ a Monte Carlo approach, which permits the inclusion of dependent and asymmetric uncertainties. Although this approach has been investigated for decades (e.g., [15, 17]), it is now much quicker to solve thanks to the advent of modern-day computing power. And since 1,000 to 100,000 solutions are required to quantify downside PXX values precisely, the latest in parallel cloud computing comes in handy. NREL’s SAM software can now solve uncertainties with non-Gaussian sources of error [15] and we at PV Lighthouse are building a generic uncertainty program for the solar industry with funding from ARENA.
It is worth noting that there is some reticence in adopting a more complicated procedure to determine uncertainty. The sum-of-squares method is so simple that it can be applied in a spreadsheet by anyone with a basic understanding of maths. However, considering how complicated the procedure is to determine P50, we think the industry will not be too concerned about applying Monte Carlo solutions to determine PXX if it is quick, transparent and more accurate.
A final forecast
Despite being an integral part of developing and operating solar projects, yield forecasts are often treated with scepticism. The PV industry is now dedicating much effort to improving those forecasts both in terms of their bias and uncertainty—to help develop more trust. Those improvements are being delivered by applying rigorous scientific approaches, by evaluating more operational data, by working towards a standardised procedure and by harnessing modern computing power. Expect to see the forecasting industry take large strides in this field over the next three years.
Author
Keith is the CEO and co-founder of PV Lighthouse, a company that builds R&D software for the PV industry. He has worked in the PV industry since 1996 and his expertise lies in the simulation and characterisation of solar cells, modules and systems. Keith has co-authored over 150 scientific articles and patents and co-created some of the best-known software in the PV industry, including SunSolve.
References
[1] 2022. Solar Generation Index. kWh Analytics.
[2] Rasmussen H. and Browne B. 2024, “Bringing solar availability assumptions back down to earth: the case for adjusting to 97%,” PV Tech, May 2024, pp. 76–80.
[3] Australian Renewable Energy Agency (ARENA). 2022, “Forecasts vs actual from the LSS projects – solar resource, generation, and spot price,” The generator operations series, Report 4.
[4] Elser K., 2024, “Financier’s View on Solar Uncertainty Analysis,” PVPMC workshop, Salt Lake City.
[5] Luminate 2023, “Luminate 2023 solar validation study,” white paper.
[6] Chawla A. 2024, “Energy yield assessment methods validation”, white paper, Natural Power.
[7] Mikofski M. and Chan C. 2023, “Addendum to the 2021 solar energy assessment validation for utility scale projects”, white paper, DNV.
[8] Chawla D. 2024, “A database assessment of solar project availability in the United States,” white paper, Natural Power.
[9] Müller T. and Spokes J. 2024, “Beyond the 2% default – Introducing PVRADAR soiling loss integration in PlantPredict,” webinar, PVRADAR and Terabase.
[10] Deline C. 2020, “PV fleet performance data initiative program and methodology”, 47th IEEE PVSC, pp. 1363-1367.
[11] Hieslmair H. 2024, “DNV’S views on long-term degradation of PV systems”, white paper, DNV.
[12] Kinsey G.S., et al. 2022, “Impact of measured spectrum variation on solar photovoltaic efficiencies worldwide”, Renewable Energy, vol 196, pp. 995–1,016.
[13] McIntosh K.R., et al. 2024, “The uncertainty in yield forecasts due to the ever-changing solar spectrum”, PVPMC workshop, Salt Lake City.
[14] Previtali J. 2020, “Methods for Estimating PV Energy Production and Probabilities of Exceedance”, technical memorandum, Wells Fargo Renewable Energy & Environmental Finance.
[15] Prilliman, P.J. et al. 2023, “Quantifying Uncertainty in PV Energy Estimates Final Report”, Technical Report NREL/TP-7A40-84993.
[16] Survey results contained in Sudbury B. 2024, “How important is yield uncertainty?” https://sunsolve.com/acprt_2024/.
[17] Thevenard, D. and Pelland, S., 2013. ‘Estimating the uncertainty in long-term photovoltaic yield predictions,’ Solar energy, 91, pp.432–445.
This project received funding from the Australian Renewable Energy Agency (ARENA) as part of ARENA’s Advancing Renewables Program. The views expressed herein are not necessarily the views of the Australian Government, and the Australian Government does not accept responsibility for any information or advice contained herein.


